Control, the Key to Living with Covid-19
Since mid-July, whenever Indonesia reported spikes in Covid-19 cases, Kompas noted down certain measurements to create an index that reflected the direction and speed of Covid-19 control at the provincial level.

A mural with the theme of a collective invitation to fight Covid-19 adorns the wall in Bukit Duri, Tebet, South Jakarta, Monday (16/8/2021).
The Covid-19 pandemic is unlikely to end soon. SARS-CoV-2, the virus that causes Covid-19, will continue to circulate for years to come. Thus, control efforts must persist.
Learning how to control a highly contagious virus is the key to living with it. This way, transmission can be suppressed and those infected will not risk dying from the disease.
Pandemic performance can be measured through an index. Several institutions, such as Bloomberg and Nikkei Asia, have ranked countries across the globe based on scores that assess their ability to control the pandemic. These scores are usually based on various indicators, including quality of health services and vaccination coverage.
Also read:
> Vaccination Information for Elderly People Limited
> Careful in Choosing Cloth Face Masks
This type of index can also be used to assess the performance of Indonesia’s provinces in controlling Covid-19 as a crucial measure, considering that the pandemic is expected to last a long time.
At the beginning between 12-19 July 2021, the nation scored a fairly low 40 on a scale of 0 to 100on this index, called the Indonesia-Kompas Covid-19 Control Index.
Since mid-July, whenever Indonesia reported spikes in Covid-19 cases, Kompas noted down certain measurements to create an index that reflected the direction and speed of Covid-19 control at the provincial level. Within eight weeks, improvements in pandemic control were visible. At the beginning between 12-19 July 2021, the nation scored a fairly low 40 on a scale of 0 to 100on this index, called the Indonesia-Kompas Covid-19 Control Index.
The direction of Covid-19 control has been positive but slow. Over the first five weeks of observation, the score increased to just 6 points, or about 1.2 points per week. It was only from the sixth week onwards that the score began showing greater leaps, increasing around 5-7 points per week.
As of 6 Sept. in the eighth week, the national score on the index reached 69. It can be inferred that the situation has returned to how it was before the second wave of infections. Meanwhile, a total of 16 provinces scored above the national average.
Elderly people wait in line outside the Health Ministry training center on Jl. Hang Jebat in Kebayoran Baru, South Jakarta, on Tuesday. They received a message broadcast on WhatsApp notifying recipients of free vaccinations for elderly people in the area. However, it turned out that the free vaccine was being offered only to elderly people with South Jakarta-registered ID cards and that the number was limited to 1,000 people per day.
The index measures the results of government policies on pandemic control by looking at two aspects: infection management and treatment management. Each aspect comprises three indicators related to health condition, protection and health service access.
The indicators for infection management comprise the number of confirmed cases, the positivity rate and vaccination coverage. These indicators reflect the efforts that have been made to prevent community transmission. Good infection management is shown by a low number of confirmed cases and low positivity rate. Protection is indicated by the vaccination rate in a community.
The indicators for treatment management comprise the recovery rate, fatality rate and hospital bed occupancy rate for Covid-19 patients. These indicators reflect the efforts that have been made to save the lives of those infected by the virus. Covid-19 patients are expected to recover quickly when treatment management is good. In addition, a low fatality rate indicates good treatment management.
Movement patterns
By analyzing these two aspects of management, this index captures not only the weaknesses that provincial administrations must address, but also the control patterns in each province, which can be mapped using a quadrant chart. Through quadrant analysis, it can be seen whether a province has good control in both aspects or in one aspect only, or poor control in both.
Each province has a different pattern in development and the time required to bring the virus under control. Two main patterns were found through observation.
These provinces are found in the quadrant reflecting good control in both infection management and treatment management.
The first pattern reflects an upward trend in which control rises from the beginning but at differing speeds. This pattern is shown by provinces such as Jakarta, Banten, Maluku, North Maluku and West Papua, all of which scored above 80 on the index. These provinces are found in the quadrant reflecting good control in both infection management and treatment management.
The second pattern reflects a downward trend from the middle of the assessment period until it reaches a turning point and resumes an upward trend. The decline occurred within a short period, usually less than four weeks, as seen in West Sumatra, Bali and Papua.
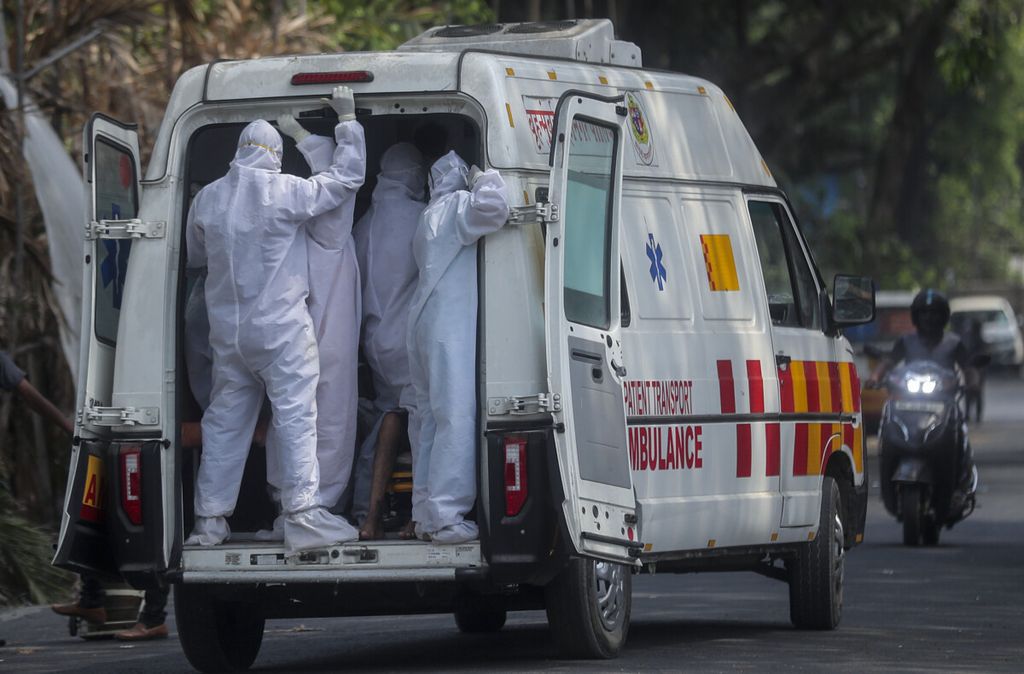
Health workers stand on the back of ambulance as they transport patients at the Jumbo COVID-19 field hospital in Mumbai, India, Monday, April 26, 2021. As India suffers a bigger, more infectious second wave with a caseload of more than 300,000 new cases a day, the country’s healthcare workers are bearing the brunt of the disaster.
However, declines have also occurred over a longer period of time that stretched more than four weeks, as seen in North Sumatra, Lampung, Central Sulawesi, West Sulawesi and Aceh. In fact, Aceh saw a prolonged decline in its scores until the seventh week of observation. Aceh is found in the quadrant reflecting poor control in both aspects from the fourth to eighth weeks.
It can be said that Covid-19 control in Java and Bali has been better in terms of speed than outside the two regions. However, there are still areas that scored lower than or equal to the national average, namely Central Java, East Java and Bali.
Also read:
> Building Optimism in Facing the Pandemic
> It\'s Time to Rebuild Spirituality
> Strengthening COVID-19 Prevention at Polling Stations
However, the better control found in Java and Bali, especially in Jakarta, does not reflect Indonesia’s overall response to the pandemic. Control still needs to be improved in many areas, especially those regions outside Java and Bali. Vigilance must be maintained to prevent the coronavirus from spreading to Java and Bali from regions outside the two regions to trigger a surge in cases again.
Complementary
The Indonesia-Kompas Covid-19 Control Index complements the government’s mapping of risk zones and epidemiological levels. The index was made possible because it uses government data. The resulting scores thus depend highly on the quality and consistency of the data authorities record.
The decline in cases over the last few weeks has caused a relatively sharp increase in scores on the control index. However, this also occurred at a time when the testing rate in several provinces did not meet the standards of the World Health Organization. Furthermore, a relatively high positivity rate of more than 20 percent was also recorded, making assessment difficult. This is a prime example of the importance of recording data that reflect actual conditions. (Kompas R&D)
(This article was translated by Kesya Adhalia).