An Evaluation of the Covid-19 Situation
Covid-19 has been with us for over a year, since the first report on 31 Dec. 2019 from Wuhan, China.
Covid-19 has been with us for over a year, since the first report on 31 Dec. 2019 from Wuhan, China.
The data recorded so far show more than 86 million cases and 1.8 million deaths in the world. In our country, the figures have reached nearly 800,000 cases and over 23,000 deaths, with 6,000 or even 7,000 cases new daily cases.
We need to evaluate the situation over the past year and determine what measures are to be taken in 2021, especially with the availability of Covid-19 vaccines.
Epidemiological curve
The epidemiological curve has often been used to illustrate the situation in a country and also the world. The curve indicates the cumulative number of Covid-19 cases on the Y-axis and the duration (date or month) on the X-axis. The curve will usually rise, reach a peak and then go down. After a decline it may certainly rise again in due time, go down again and repeat this cycle. As it takes on a pattern resembling the undulating surface of the sea, the recurring up-and-down movement is called a wave. There can thus be a second wave, a third wave, and so on.
Also read: The Hardest Step When the Cases Increase Rapidly
Since the beginning of 2020, the World Health Organization (WHO) has periodically compiled the data reported by each country and published the epidemiological curve per country. In referring to the WHO data gathered in mid-December, the epidemiological curve of affected countries in the world can be divided into several patterns.

This handout photo taken and released on August 11, 2020 by Presidential palace shows President Joko Widodo (C) visiting the Bio Farma Pharmacy that produce vaccines for COVID-19 coronavirus in Bandung, West Java. - Indonesia on August 11, 2020 launched human trials of a Chinese-made coronavirus vaccine with some 1,600 volunteers slated to take part in the six-month study.
Some countries saw an increase and then a decline in cases, leaving behind only a small number of cases, such as Thailand and Singapore. Still other countries saw an increase and then a decline in cases, followed by another increase and decline or several increases and declines to experience two or more peaks before a gradual fall to low numbers, such as Australia and New Zealand.
Also read: Vaccine Diplomacy amid the Pandemic
There is also a group of countries that never saw a surge in cases from the outset, maintaining a relatively low, flat curve with some minor peaks, like Laos and Cambodia.
Some countries saw an increase in cases, followed by a decline and then a rise to see a second or even third wave, and their cumulative figure remains high today, such as several European countries and Japan.
Indonesia and the United States fit this pattern, as does the general curve for the global pandemic as a whole.
And then, of course, there are those countries seeing a continuing increase in cases with no decline as yet. Indonesia and the United States fit this pattern, as does the general curve for the global pandemic as a whole.
However, the epidemiological curve may not fully reflect the actual situation, because the number of detected cases depends on how many tests per population a country conducts.
Also read: Hospitals in Critical Condition, Patients Left Untreated
The more tests a country administers, the greater its number of new cases may be. But once new cases are detected, a country can intensify its contact tracing and isolation efforts to better control the local virus transmission. Another factor that may affect the shape of the WHO’s epidemiological curve is that, since it is based on the reports from individual countries, the time frame may be different, as well as the method of reporting. Yet, despite these limiting variables, the patterns of the existing epidemiological curves at least gives a general picture of the pandemic over its course in 2020 and can be used to determine the appropriate control policy.
Positivity rate
Another aspect that is frequently discussed is the positivity rate. This figure indicates how many people have tested positive for the virus compared to the total number of people who were administered the polymerase chain reaction (PCR) test. In fact, the WHO indicates that the positivity rate should be at most 5 percent for the situation to be deemed controllable. The Covid-19 webpage of Our World in Data groups together countries by positivity rates of below 1 percent and then 2 percent, 3 percent, 4 percent, 5 percent, followed by 10 percent, 20 percent, and above 50 percent.
Also read: Wear a Face Mask, Do Tracing
The positivity rate is mentioned as a good indicator for evaluating whether a country is conducting adequate testing, as it indicates the country’s testing rate in terms of the extent of infections in that country. The available data show a broad variation among affected countries in the world, with some countries recovering a positivity rate of around 1 percent, like Australia and Uruguay, while others have a rate of between 20 percent and 50 percent or more, such as Mexico and Bolivia.
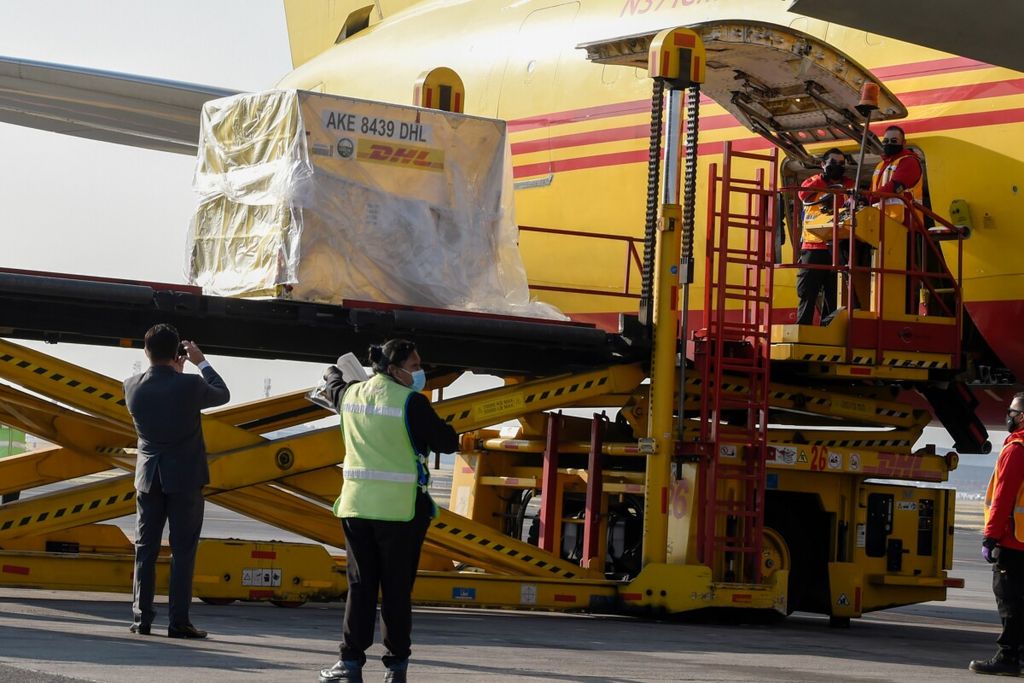
Employees unload shipping containers of the Pfizer Covid-19 vaccine from a plane of the international courier company DHL, at Benito Juarez International Airport in Mexico City on December 23, 2020. - Mexico will begin Covid-19 immunizations on Thursday, a day after the country receives its first batch of Pfizer-BioNTech vaccines, Undersecretary of Health Hugo Lopez-Gatell said.
Over the last few months, Indonesia’s positivity rate has been more than 10 percent, which demands caution. It is certainly hoped that the situation can be managed so that we don’t remain among the group of countries with a positivity rate of above 2 percent. Aside from the positivity rate, some other indicators like the fatality rate and recovery rate also help to illustrate a country’s Covid-19 situation.
3M, 3T and vaccines
Considering the developments to the present, it seems that the only choice is to encourage strict adherence to the so-called 3M protocols of masks, physical distancing and handwashing, and even the other “Ms” like following the coughing etiquette and contactless greeting, avoiding gatherings, ensuring good ventilation and fresh air circulation, and maintaining healthy lifestyles. Implementing the 3T strategy of “test, trace, treat” should obviously be promoted, especially during periods such as the recent year-end holiday season with all its potential problems.
President Joko Widodo has also announced that the vaccine will be free.
The main topic of discussion since the end of 2020 is vaccines. The first batch of the Covid-19 vaccine has arrived in the country. President Joko Widodo has also announced that the vaccine will be free. The realization of the mass vaccination program is pending the granting of emergency use authorization (EUA) from the Food and Drug Monitoring Agency (BPOM), and of course the decision of the Indonesian Ulema Council (MUI) on the vaccine’s halal status. Health Ministerial Decree No. HK.01.07/Menkes/9860/2020 lists the six types of Covid-19 vaccine that
are to be used in Indonesia. Certainly, many factors were considered in choosing the vaccines that will be administered in the country, although the two key factors are safety and efficacy.
Apart from these two factors, three other crucial aspects are the distribution strategy, the vaccination phases for eligible groups and finally, public acceptance of the vaccine program.
In distribution, the three important components are the availability of trained staff, a reliable and detailed management system and the establishment of a cold chain to guarantee delivery to remote parts of the country.
Ambulance carrying Covid-19 patients to the Wisma Atlet Covid-19 Emergency Hospital, Kemayoran, Central Jakarta, on Sunday (3/1/2021).
Regarding the phases of inoculating recipient groups, all circles agree that health workers and other essential workers who interact directly with the public are the top priority. The next phase should involve high-risk groups, including old-age people as per the WHO recommendation.
It is indeed the case that some vaccine trials only involved volunteers of the younger age groups, but it is worth noting that two or three other vaccines listed in the Health Ministerial Decree have published research results attesting to their safety and effectiveness for people above 60, and this should also be taken into consideration.
In the case of public acceptance, the WHO mentions in a November publication the need for a four-pronged integrative strategic approach. Implementing these four strategies in Indonesia should be considered now, ahead of the nationwide vaccination program. The first is controlling of the infodemic on social media and countering misinformation with facts. We are aware of the many reports about the Covid-19 vaccines circulating from a variety of unclear sources that are being spread directly to members of the public on their cell phones, which should be dealt with in all seriousness.
Also read: Innovations to Rise Up After the Pandemic
The second strategy is the capacity to execute risk communication and public empowerment. This involves three key measures: providing accurate information about the vaccines to be used, engaging in open and interactive communication with the public, and providing clear information about who will be inoculated and when.
Tjandra Yoga Aditama
The third strategy refers to the central role of frontline health workers, both those who will administer the vaccines and others who interact with the public on a daily basis. The public follows their views most closely, and therefore they must be fully confident that the Covid-19 vaccines are safe and effective based on reliable scientific evidence.
Finally, the fourth is to develop a crisis communication strategy to anticipate potential issues of a sensitive nature that could emerge during the vaccination program.
Tjandra Yoga Aditama, Professor of Pulmonology, Faculty of Medicine, University of Indonesia; Former Director of WHO SEARO and former Director General of Disease Prevention and Control & Head of Health R & D Agency
(This article was translated by Aris Prawira)