V-Shaped Recession Curve amid Pandemic
The World Bank has predicted that the Indonesian economy will suffer negative growth for the first time since 1998 this year at a range of between minus 2 percent and minus 1.6 percent.
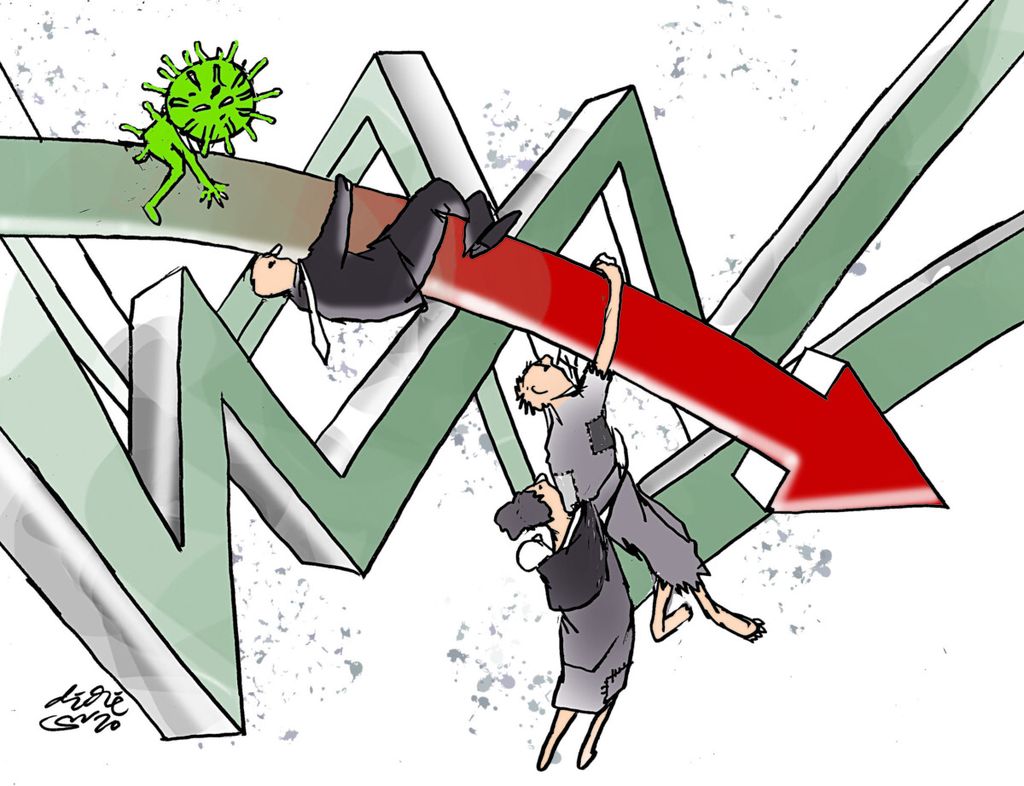
The World Bank has predicted that the Indonesian economy will suffer negative growth for the first time since 1998 this year at a range of between minus 2 percent and minus 1.6 percent. This implies that growth in the third and fourth quarters will be negative, although it will not be as deep as the second quarter.The recovery curve will be an asymmetrical modification of the V-shaped curve with a sloping right tail. This reflects that the Covid-19 pandemic has caused different consumption patterns, between the lower middle and upper middle groups of society.
Recovery curves in several countries
There are two types of recovery curve, which are quite different, namely that in China, which has a V recovery curve due to the discipline of its people and vaccines, and that in the European Union. In addition to its position as the world\'s manufacturing hub, China can optimally use its stimulus facilities to prop up the economy. After experiencing negative growth of 6.8 percent in the first quarter of 2020, China managed to recover and recorded 3.2 percent growth the following quarter.
Read also: Deflation Amid Threat of Recession
On the contrary, in the EU, after strict regional quarantine was imposed in most EU countries, the V-shaped recovery has not been seen. Whether the recovery curve will be in the form of a V or not will depend on the growth in the third and fourth quarters. If the contraction is as deep as or even deeper than that in the second quarter and then occurs again in the following quarters, the recovery curve could be in the form of a “U” or even “L”.
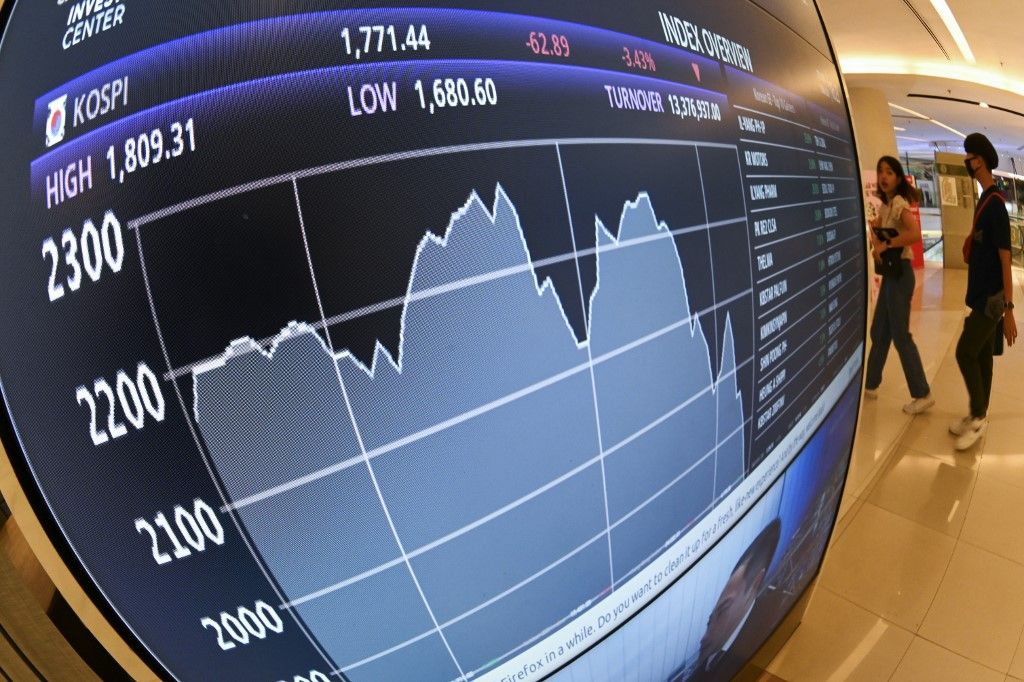
A man wearing a facemask amid concerns over the spread of the COVID-19 novel coronavirus, walks past a stock market display board showing movements of the South Korea\'s stock index at a shopping mall in Bangkok on March 15, 2020. - The world markets were sent into meltdown by fears over the coronavirus outbreak that has threatened to plunge the global economy into recession.
Spain and France are among the EU countries that depend on the service sector, particularly tourism. The two countries are in lockdown, which is among the strictest. Both countries have suffered a deeper contraction in their economy since the first quarter of 2020. Spain\'s growth worsened from minus 4.2 percent in the first quarter to minus 21.5 percent in the second quarter, while France’s economic growth fell further from minus 5.7 percent to minus 18.9 percent in the same period.
Vietnam was able to avoid negative growth. The Covid-19 pandemic only caused Vietnam\'s economic growth to decline from 7 percent in the fourth quarter of 2019 to 3.82 and 0.36 percent, respectively, in the first and second quarters of this year.
Vietnam has adopted a universal war concept based on its experience during the war against the US. Every citizen becomes an informant to find the people who show symptoms of Covid-19. Vietnam becomes a giant surveillance machine that collaborates with health system data centers with immediate reporting.
Read also: Pushing Back Inflation
With such a mechanism, a massive lockdown such as those imposed in the EU is not needed as tracking can work effectively at a micro level. An adaptive and selective lockdown like the adaptive learning design (Evans and Honkapohja, 2001) was launched immediately when news of the outbreak in Wuhan broke out in February, closing schools, communities, borders and a 14-day quarantine for overseas visitors. As a result, logistics mobility can be maintained so that economic growth, although declining remains in the positive zone.
Japan, in the first quarter, was able to minimize the contraction in economic growth to minus 1.8 percent and was quite optimistic amid the partial lockdown in Tokyo and Osaka.
In fact, the government has poured out US$929 billion in the first stimulus package and another $ 1.1 trillion in the second package in to spur the economy.
Japan was very surprised when its economy shrank 9.8 percent in the second quarter, this year. In fact, the government has poured out US$929 billion in the first stimulus package and another $ 1.1 trillion in the second package in to spur the economy. But Japan did not take into account its aging population.
Groups of people who are quite old are not interested in buying durable goods. Meanwhile, young people are more concerned with access than ownership, both for vehicles (public transportation) and property (renting). The only consolation for the people is taking trips, which are difficult due to the pandemic. Automotive exports are also stagnant due to recession in export destination countries. This results in a liquidity trap phenomenon. The stimulus has failed to turn the economy around because a large part of the liquidity is in the form of savings.
Read also: Racing Against Pandemic
In order to be able to roll back economic activities, Japan has introduced the so-called “travel bubble”, in which travelers from 10 countries deemed able to control Covid-19 are given priority to visit the country.
How about in Indonesia?
The curve of economic recovery in Indonesia this time will likely be different from that during the 1998 crisis. At that time, the crisis was mainly caused by the “mega” depreciation of the rupiah against the US dollar, during which the Indonesian currency fell from Rp 2,500 per US dollar to as low as Rp 15,000 per US dollar. It needed six quarters for the economy to return to positive growth.
The negative growth began in the first quarter of 1998 and continued to worsen until it reached its lowest of minus 18.3 percent in the fourth quarter of 1998. The economy then started its recovery although it was still in the negative zone. The economy returned to positive growth in the second quarter of 1999.
A sales promotion is installed in the glass of an outlet at Central Park Mall, West Jakarta, on Sunday (4/10/2020). During a pandemic, visitors and turnover have decreased. Retailers are also threatened to increase the number of employees laid off and the possibility of closing their business premises.
Although it took a long time, with a deep contraction in the fourth quarter of 1998, graphically the recovery curve looked like a “V” with a steep tail. However, full recovery did not occur immediately. Although the economy had recorded positive growth, it took two more quarters until the fourth quarter of 1999 to reach growth above 5 percent.
Read also: Synergy Between Braking and Acceleration
The economic crisis facing the world this time is mainly due to the pandemic, which has severely disrupted the demand and production side of the economy. Based on predictions from the government and the World Bank, it seems that for Indonesia the V recovery curve will not be too deep. The pandemic caused growth to slow down to 2.87 percent in the first quarter of 2020.
The contraction occurred in the second quarter with growth of minus 5.32 percent, much better than that in 1998.
The Indonesian economy is projected to suffer a contraction of 2 percent in the third quarter (World Bank) or 2.9 percent (government). This shows that the V-shape recovery curve will lean to the right with an elongated tail, which indicates that even if the contraction is not as deep as other countries, the recovery will occur gradually, perhaps it could even begin in 2021.
Policy implications
The recovery pattern and the time required to regain positive growth depend on the public demand, particularly consumption. Learning from the 1998 economic crisis, consumption was the main contributor to economic recovery, followed by investment as a source of economic growth. The proverb goes "hemat pangkal kaya” (saving makes you rich) but the paradox of the thrift concept is that excessive saving can actually lead the economy into a deeper recession.
Read also: Absorbing the Cost of Recession
The community is not really to blame because it is caused by the pandemic. Therefore, it is important for the government to manage people\'s expectations in its economic recovery program.
This means that people spent only 67.4 percent of their income for consumption.
The latest Consumer Confidence Index (CCI) data published by Bank Indonesia show a decline in the marginal propensity to consume (MPC) from 0.69 in March to 0.674 in August. This means that people spent only 67.4 percent of their income for consumption.
Meanwhile, the percentage of savings increased from 18.6 to 20.4 percent in August. The remaining income was used for loan installments, the portion of which was relatively stable at 12.2 percent. The installment has the potential to be used as a target for future relaxation policies in order to be able to switch the expenditure.
Read also: The Burden of National Debts
The spending trend above occurred to people with monthly income of between Rp 1 million and Rp 5 million, but not for those with monthly income of above Rp 5 million. The people increased their savings due to a layoff threat. The pandemic affects the people’s mobility and physical interaction, which disrupts production activities, causing an increase in the layoff threat. A survey conducted by the
research and development department of the Manpower Ministry, the Indonesian Institute of Sciences (LIPI) and the University of Indonesia’s Demographic Institute found that 13.9 percent of employers had laid off part of their workers. Meanwhile, 49.6 percent had furloughed their workers.
Only those with monthly income above Rp 5 million saw their savings decline. Their savings decreased from 19 to 18 percent, which indicated that there was an increase in their expenditure. However, the purchasing index for durable goods in this group declined slightly to 75.2 in September. It rose sharply to 77.5 in August from 60 in July.
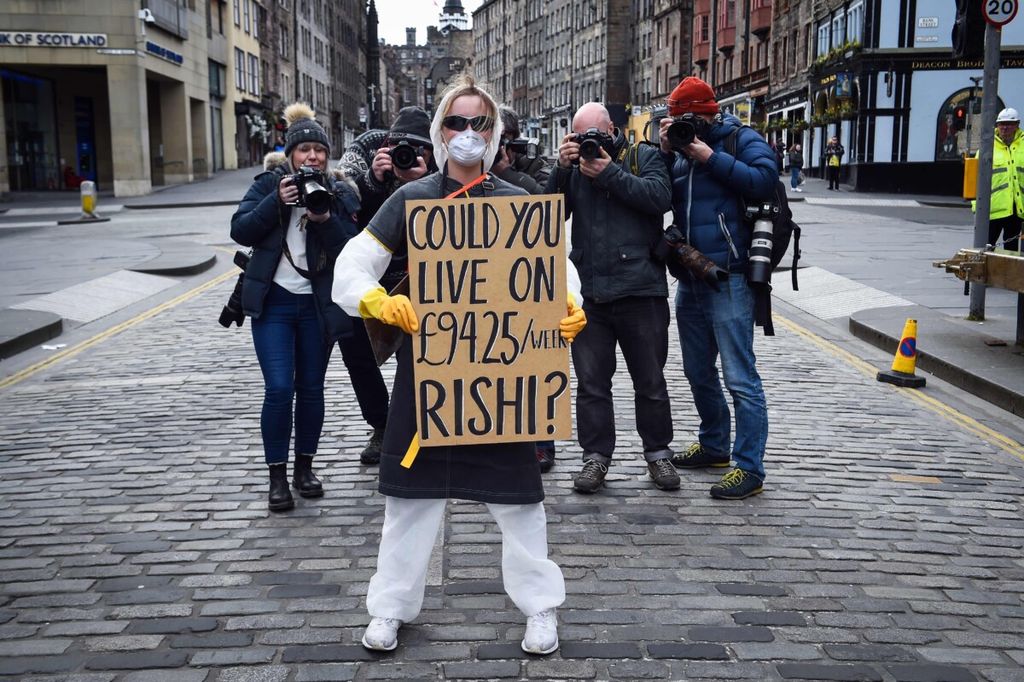
A woman wearing a protective face mask and gloves holds a placard complaining about the lack of suport for the self-employed and zero hours contract workers, on the Royal Mile in Edinburgh in Scotland on March 23, 2020, as governments scramble to defend their own economies against the coronavirus COVID-19 pandemic in order to ward off a long-term global recession and future waves of infections.
The figure indicates that these groups are still able to travel or dine out for relaxation and leisure, but they are still not interested in buying durable goods.
Another symptom showed that the people that purchase durable goods, such as household appliances, were those that came from the income group of between Rp 1 million and Rp 2 million. At first glance it looks like an anomaly. The explanation is that; with the decline in the MPC, although some were still able to save part of their income, the social assistance for this income group has contributed to the shifting of leisure spending to durable goods (expenditure switching).
The rise in the Purchasing Managers Index (PMI) from 46.6 in July to 50.8 in August was a consequence of such expenditure behavior. However, this behavior was not yet stable. For the record, the PMI index fell again to 47.2 in September in line with the reinstatement of large-scale social restrictions in Jakarta due to the increase in new Covid-19 cases. The loan installment relaxation has the potential to make this behavior more stable.
During the 1998 crisis, the agricultural sector continued to grow, followed by recovery in the trade, hotel, restaurant and manufacturing sectors, which helped the economy to come out from the recession. In order to be able to have a V-shaped recovery curve, there are two groups of people that require special attention. Each of them requires different policies.
Ari Kuncoro
For the lower middle class, the disbursement of the National Economic Recovery (PEN) budget, which is focused on social assistance and business incentives, should be further increased because their spending behavior has the potential to boost the growth momentum in the manufacturing sector.
For the upper middle class, efforts to improve the public health condition must be further improved with better coordination in handling Covid-19. The spending of this income group can stimulate recovery in the trade, hotel and restaurant sectors and to a lesser extent the transportation sector.
ARI KUNCORO, Rector of the University of Indonesia.